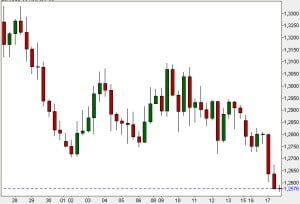
 The challenge for many new forex traders is to identify the overall trend on the intraday charts. The 200 Exponential Moving Average (EMA) can solve the problem for them. 200 EMA is one of the most popular technical analysis indicators amongst forex traders.
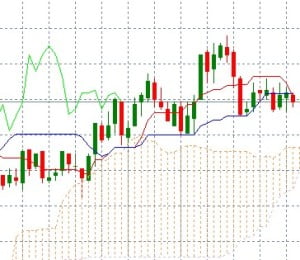
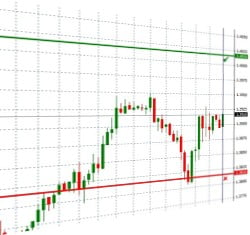
In order to use the 200 EMA Forex Strategy open the 4 hour, 1 hour and the 15 minute charts on your MT4 Platform. Plot the 200 EMA on these 3 charts and color it red.
Tile the three charts in a vertical fashion so that you can view the three charts one above the other. Now, scroll through the various currency pairs like the EUR/USD, GBP/USD, USD/CHF, USD/JPY, USD/CAD, EUR/JPY, AUD/USD, NZD/USD, EUR/CHF or whatever pair you like to trade.
Read more


 Risk to award ratio is often used when evaluating the risk of a Forex trading strategy, be it manual or automated. It’s one simple number that can tell a lot about a strategy. In fact, this number alone can tell a good strategy from a bad one. So what is the Risk to Award ratio and how do we use it?
 Foreign Exchange Market or Forex is currency trading market and is similar to stock market. The currency pairs are on a trade like shares, only the difference is Forex is much simpler and a lot more active. It is said that because it’s more active, it is a lot more risky. However, in my opinion it doesn’t matter how fast market moves, the risk involved is highly subject to the trader himself. When further comparing stock market and Forex, we must note that sometimes the shares can plummet overnight like none currency pair would ever.