The Fibonacci retracement tool is one of those tools in forex that a forex trader simply cannot do without. This is because in the financial markets, prices do not move in a continuous straight line, but in a convoluted twist of pullbacks and advances. Whenever the price action of a currency has moved substantially in a particular direction due to a very strong trend, those traders who were able to get in early would at some point, decide to take some profits from their trades. This will place the gaining currency on offer and will lead to a supply excess over demand for that currency at that particular time, leading to price pullbacks.
A dilemma has always been how to determine with some degree of accuracy, how far the price action of the currency will pull back before resuming the move in the direction of the previous trend. This renewed move in the previous trend occurs because traders now perceive the currency in question to be at bargain levels, low enough to be able to still grind out some advance movement for profit.
This is where the Fibonacci retracement calculator comes into play. Traders can use it to identify the possible levels to which prices will pull back, and there are five levels to choose from.
In this piece, we will deal with how to correctly apply the Fibonacci retracement tool to a forex chart, as this is one area where traders make mistakes when using the Fibo tools.
Step 1
The first step is to open an appropriate time frame chart. The Fibo tool is used to detect levels at which trend retracements will end. Trends can only be correctly determined from longer term charts such as the daily chart. So you can open a daily chart as the first step.
Step 2
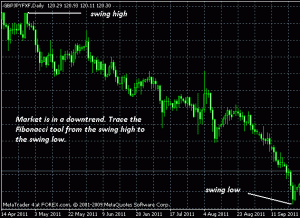
Identify the swing high and the swing low for the forex chart. The swing high is the highest point the price action has reached for the time period in view. The reverse is also true for the swing low.
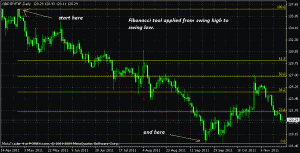
Select your Fibo tool, and if the market is in an uptrend, apply it to the swing low and trace the tool to the swing high. If the market is in a downtrend, apply the Fibonacci retracement tool from the swing high to the swing low.
Step 3
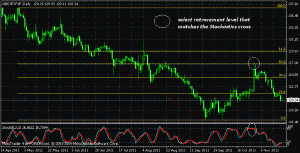
Apply a supporting technical indicator to the chart. The Stochastics oscillator, which detects overbought and oversold conditions and hence is perfect for detecting reversals, works very well here. Select the retracement level where the Stochastics cross at the oversold region for an uptrend (with downward retracement) or at the overbought region for a downtrend (with an upward retracement).
Once you get the appropriate retracement level, it is time to take your trade in the direction of the main trend.
After reading this piece, you should be able to plot your Fibonacci retracement tool correctly so you can detect the appropriate level at which the retracement ends and a new round of buying begins.


